“Everything should be made as simple as possible without sacrificing accuracy.” In strategic mine planning, we are constantly challenged to find simplified models that best describe the real life behaviour of mining processes. Overly complex models are typically avoided as they compromise the speed and computing power of optimization technology.
Too much simplicity on the other hand can lead to false conclusions and incorrect results. Finding the right balance is essential. One particular challenge within the strategic modelling space is modelling nonlinearities with respect to material type and/or grade as they appear in the many aspects of processing. These include processing throughput, processing recoveries, reagent consumption, power consumption or beneficiation of grades.
In this article, we will show you how to deal with nonlinearities caused by processing material blends and we will model this behaviour using the Minemax Scheduler strategic mine planning tool.

Why Nonlinearities Complicate Things
To start with, let’s consider mill recovery for a blend of two different material types. In our example, we will be producing a 2:3 blend of materials A and B. For this situation, we will be processing 20,000 tonnes of material A at a grade of 2g/t and 30,000 tonnes of material B at the same grade of 2g/t. We know that the mill recovery for material A is 80% while the mill recovery for material B is 90%.
If nonlinearities are not accurately modelled then the strategic mine schedule may not be optimal or even valid.
If we assume a linear relationship of recovery for these material types, then this will give the following results:
Contained Metal A = (20,000*2) = 40,000 g
Contained Metal B = (30,000 *2) = 60,000 g
Total Contained Metal A+B = 100,000 g
Recovered Metal A = (20,000*2*0.8) = 32,000 g
Recovered Metal B = (30,000 *2*0.9) = 54,000 g
Total Recovered Metal A+B = 86,000 g
Total Recovery A+B = 86,000/100,000 = 86%
However, if the actual recovery of a 2:3 blend is 83%, we will get a different amount of recovered metal:
Total Recovered Metal A+B = 50,000 *2*0.83 = 83,000 g
This simple example illustrates clearly that if we use a simplified linear representation of recoveries, we will incorrectly estimate recovered metal by 3,000 g. If nonlinearities are not accurately modelled for strategic schedule optimization, then the schedule may not be optimal or, even more importantly, may not be valid. The degree to which the result is sub-optimal or invalid is related to the degree of nonlinearity.
Simple Linear Modelling
Let’s model the above example in Minemax Scheduler using a linear modelling approach. To do this, we model mill and waste dump destinations as alternative processes. This means that during the optimization we calculate a profitability for each block, which informs whether material should be processed in a mill, or sent to a waste dump in order to maximize the total net present value. The decision tree for this situation is shown in the screenshot below:
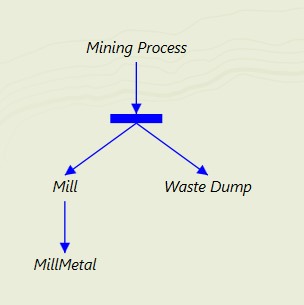
For material going to the mill, we calculate the recovered metal of each block which is represented by the ‘MillMetal’ process in the process decision tree. In this approach, the mill recovery is a function of the blend of material types and grade, similar to our simple linear example above.
Simple linear modelling of nonlinearities will most definitely produce incorrect results.
For this modelling approach, the recovered metal is only correct if all material going to the mill in a time period is the same material type and grade range for all blocks. Unfortunately this is hardly ever the case and so this approach will most definitely produce incorrect results. So what can we do about this?
Linear Approximation of Nonlinear Modelling
One approach to dealing with nonlinearities is to use a linear approximation by creating a piecewise linear function. This means we define a number of discrete blends of materials A and B for which we know the correct mill recovery. For our example of a tonnage based blend of two material types ‘material A’ and ‘material B’, let’s assume that we know the correct mill recovery for 7 discrete blends with blend ratios of 20:80, 30:70, 40:60, 50:50, 60:40, 70:30, and 80:20.
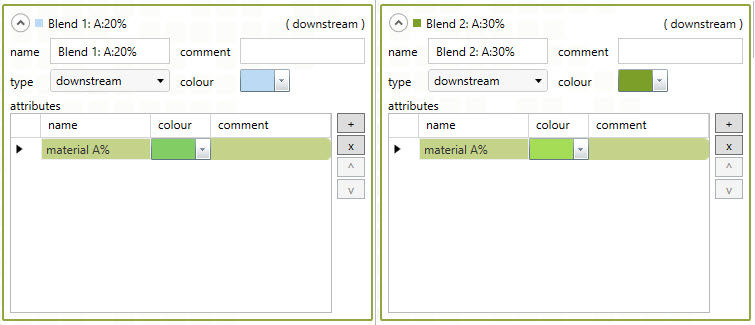
To model processes for these blends in Minemax Scheduler, we base them on a percentage of material A tonnes contained in the blend. We can model it this way because for 2 material types, material B represents the remaining percentage to balance out the total of 100%. For instance, for blend 1 (blend ratio 20:80) we will define a process called ‘Blend 1: A:20%’ which means it contains 20% of material A tonnes and 80% of material B tonnes.
In this approach, we can’t define a recovery curve, so the definition is piecewise. Each recovery range is therefore discrete, and covers the specified blend +/- 5%. For example, the recovery for ‘Blend 1: A:20%’ also covers blends containing 15% – 25% of material A. By doing this, we ensure that all possible blends are covered by one (and only one) recovery definition.
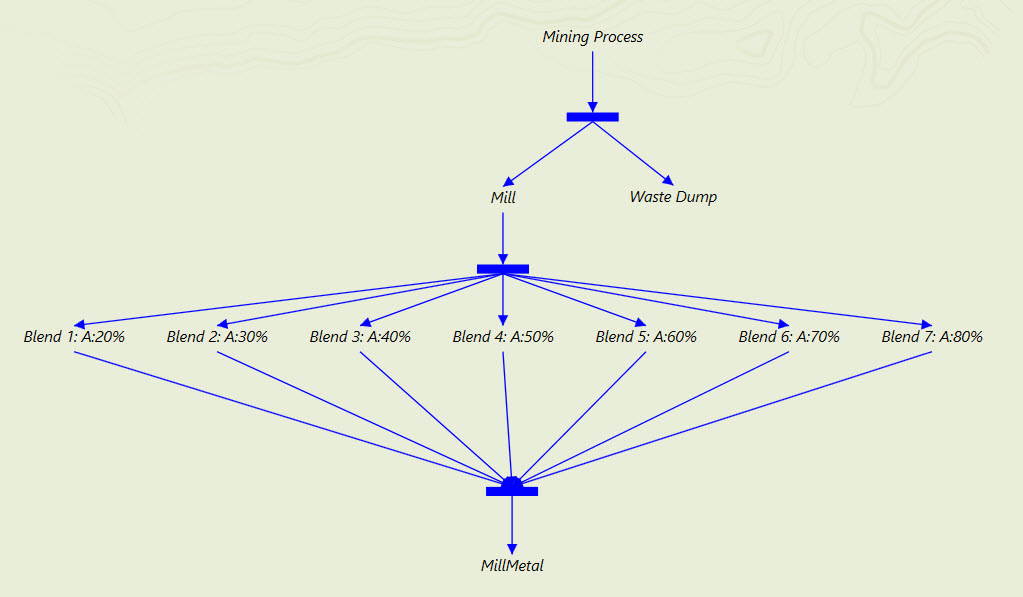
The recovered metal for each blend is based on the recovery for that particular blend applied to the grade of each block in the blend, and contributes to the total ‘MillMetal’ process.
Piecewise linear approximation of nonlinearities increases the validity of our schedule.
There is still one missing piece in the puzzle as we need to ensure that the mill receives a given blend using the blend ratio. In Minemax Scheduler, we use blending constraints to do this. To constrain the model, we need to define an attribute for each blend that represents the percentage of material A in the blend and then constrain it with the appropriate range. That allows for the specified blend +/- 5% margin. In the example below, we can see a model setup for constraints of blends 1 and 2: Blend 1: 15 ≤ material A% < 25 Blend 2: 25 ≤ material A% < 35

During the optimization, Minemax Scheduler ensures that the resulting schedule satisfies these constraints and gives us the guarantee that we have found a truly optimal schedule.
What Should You Know About Nonlinear Modelling?
There are a few things you should know about models produced using a linear approximation:
- Remember that linear approximation is only an approximation, not an exact model, and the key is to define blend ratio processes appropriate for the degree of nonlinearity in the model.
- Be aware that the number of blend ratio products can become very large as more material types and possibly grade ranges are added.
- In real models, you should apply linear approximation to each property of milling you wish to model, not only to recovery. For example, this would be processing throughput, reagent consumption, power consumption or beneficiation of grades.
- Reblocking can introduce inappropriate linear combinations of blocks even before optimization occurs. For this reason, at the time of import, consider reblocking strategies that bin blocks consistently with the blend ratios being modelled.
Summary
There is no doubt that dealing with nonlinearities in processing models is a complicated task. If we simplify the model to use a linear representation of the processing model, then we are most likely to lose some accuracy in our model which can lead to sub-optimal schedule results. On the other hand, if we consider an appropriate level of piecewise linear approximation for nonlinearities in our model, there is a good chance that we will increase the validity and net present value of our schedule and find a truly optimal solution. Do you struggle with nonlinearities in your strategic model? Contact us and we will be happy to discuss your specific situation in more detail.